< Engagement Rings / Commitment Report
↘ April 21, 2026 • Report
Across the U.S., commitment is being redefined. Our 50-state analysis ranks where Americans are getting engaged, marrying, staying together – and reveals the diamond choices shaping today’s proposals.
50
States Analyzed
16
Data Points
Utah
#1 Most Committed

Across the U.S., commitment is taking on new meaning. Shifting relationship norms, changing cultural attitudes, and ongoing economic pressures are influencing not only when people choose to commit, but also how that commitment is expressed. Traditional milestones such as engagement and marriage remain important, but they are increasingly shaped by personal timing, financial readiness and individual priorities.
The 2026 Relationship Commitment Report explores how this landscape is evolving, drawing on a comprehensive analysis of all 50 states. It brings together key indicators, including marriage rates, age at marriage, relationship stability, and proposal interest. Alongside this, it considers broader cultural signals, from how romance is reflected in pop culture to the continued role of natural diamonds in marking meaningful moments.
Where relevant, these metrics are weighted against population to ensure a fair comparison across states. Together, they form a Commitment Score for each state, offering a view of how commitment is expressed across the full journey, from early intent through to long-term stability.
01
Commitment is evolving, not disappearing.
Across the U.S., people are still seeking commitment, but increasingly on their own terms, with timelines becoming more flexible and personal.
02
Utah ranks as the most committed state in the U.S.
With a high marriage rate and the youngest marriage ages, Utah leads the nation in turning intent into action.
03
Romance is thriving, even where commitment is delayed.
States like New York show strong engagement with proposals, weddings and romantic inspiration, even when formal milestones like marriage might happen later.
04
Financial readiness can influence commitment timing.
In states with lower living costs and more affordable weddings, such as South Dakota and Iowa, moving from planning to committing may feel more accessible.
05
Search interest in new engagement ring styles is rising, while timeless classics still lead in sales.
While classic choices like round diamonds remain the most popular in sales, search interest shows people are also exploring a wider range of styles.
Where in the U.S. is commitment most clearly taking shape today?
This section highlights the top 10 states with the highest overall Commitment Score. These states are assessed across three core pillars, each reflecting a different stage of the commitment journey:
| Rank | State | Behaviour | Stability | Romance | Score* |
|---|---|---|---|---|---|
| 1 | Utah | 77 | 63 | 63 | 68.7 |
| 2 | Nebraska | 54 | 71 | 61 | 61.0 |
| 3 | Idaho | 63 | 76 | 42 | 60.7 |
| 4 | Kansas | 58 | 65 | 58 | 60.5 |
| 5 | Tennessee | 57 | 63 | 62 | 60.3 |
| 6 | Arkansas | 69 | 59 | 48 | 59.8 |
| 7 | Kentucky | 62 | 62 | 55 | 59.8 |
| 8 | South Dakota | 62 | 68 | 47 | 59.3 |
| 9 | Texas | 45 | 57 | 80 | 59.2 |
| 10 | Missouri | 55 | 65 | 58 | 58.8 |
| National Average | 44 | 55 | 59 | 51.9 |
* Commitment Score
Utah ranks as the most committed state in the U.S., with a culture where relationships tend to take shape earlier and more consistently than elsewhere. A marriage rate of 11.2 per 1,000 people (above the national average of 6.6), combined with the youngest median marriage ages in the country (27.2 for men and 25.2 for women), points to a place where settling down remains a clear and widely shared priority.
That intent shows up well before the milestone itself. High levels of engagement and proposal interest, averaging around 18,000 searches each month, suggest that for many, commitment is something actively planned and anticipated.
While the divorce rate sits at 8.1 per 1,000 people, slightly higher than the national average, the overall picture is one of balance, where relationships are not only formed earlier but, in many cases, sustained over time.
In Nebraska, commitment is defined by staying power. The state ranks second overall, underpinned by one of the strongest stability profiles in the country, suggesting that relationships here are built to last.
While the state’s marriage rate sits at 5.3, slightly below the national average of 6.6, and marriage ages reflect a more measured timeline, commitment in Nebraska appears less about speed and more about longevity.
A lower-than-average divorce rate of 7.1 per 1,000 people reinforces this, highlighting a culture where relationships, once formed, are more likely to endure.
In Idaho, people tend to commit earlier, and for many, that commitment is part of a longer-term plan. Ranking third overall, the state reflects a culture where settling down remains a clear priority.
With a younger marriage age (28.2 for men and 25.4 for women), many are reaching key relationship milestones sooner than elsewhere. Notably, Idaho has the lowest proportion of men who never marry, suggesting that long-term partnership is still a widely shared expectation, rather than an exception.
While the divorce rate sits slightly higher at 9.2, the broader picture points to commitment being both widely pursued and, in many cases, maintained over time.
In Kansas, commitment is shaped by consistency, with people taking a steady and considered approach to building long-term relationships. Ranking fourth overall, the state stands out for its balanced performance across behaviour, stability and romance.
While the marriage rate sits at 5.3, slightly below the national average, people are still reaching key milestones relatively early, with marriage ages of 28.8 for men and 26.2 for women. This suggests that commitment is less about frequency and more about timing and intent.
That intent is reflected in strong levels of engagement and proposal interest, with an average of 16,000 monthly searches. Although the divorce rate is slightly above average, it still seems like commitment remains an active and considered choice.
In Tennessee, people are reaching key milestones at a steady pace. With a marriage rate of 7.3 per 1,000 people and relatively young marriage ages, settling down remains a natural next step for many.
That intention shows up early. With over 38,000 engagement and proposal-related searches monthly, there’s a clear appetite not just for commitment itself, but for how it’s planned, celebrated, and shared.
While the divorce rate sits at 9.1, slightly above the national average, the overall picture suggests that commitment here isn’t fading; it’s something that continues to be both pursued and celebrated
Commitment doesn’t look the same everywhere, and in some states, it’s simply expressed differently.
This section explores where traditional markers of commitment, such as marriage rates, proposal interest and long-term stability, are less prominent today. While these states rank lower on the overall Commitment Score, this does not necessarily point to an absence of commitment, but rather a shift in how and when it takes shape.
In many cases, relationships follow longer timelines, with milestones happening later or outside of conventional pathways.
| Rank | State | Behaviour | Stability | Romance | Score* |
|---|---|---|---|---|---|
| 1 | Georgia | 20 | 45 | 19 | 27.0 |
| 2 | New Mexico | 23 | 25 | 38 | 27.9 |
| 3 | Rhode Island | 21 | 26 | 68 | 36.6 |
| 4 | Maryland | 27 | 36 | 66 | 41.3 |
| 5 | Massachusetts | 21 | 34 | 79 | 42.1 |
| 6 | California | 24 | 34 | 79 | 43.3 |
| 7 | Connecticut | 25 | 40 | 73 | 43.8 |
| 8 | Hawaii | 36 | 45 | 59 | 45.6 |
| 9 | Vermont | 34 | 62 | 47 | 46.1 |
| 10 | Oregon | 37 | 52 | 53 | 46.4 |
* Commitment Score
In Georgia, commitment tends to take shape more gradually. With a marriage rate of 5.9 per 1,000 people (below the national average of 6.6) and slightly older marriage ages, key milestones are often reached later.
There’s also less urgency around the build-up to those moments. Lower levels of engagement and proposal-related search interest suggest that, for many, commitment isn’t driven by immediacy, but approached more deliberately.
That slower rhythm carries through over time. With a divorce rate of 8.7 per 1,000 people, above the national average, and more limited engagement with romance-related searches overall, commitment here feels less defined by traditional signals and more by individual timing and personal pace.
In New Mexico, commitment is less defined by traditional milestones. A lower marriage rate of 4.7 per 1,000 people, combined with limited interest in proposals and engagements, suggests that formal markers like weddings don’t hold the same significance.
Relationships here don’t always follow a clear, linear path. With a divorce rate of 9.1 per 1,000 people, above the national average, the picture is more fluid, where commitment may take different forms and evolve over time.
In Rhode Island, commitment tends to arrive later, but with more intention. A marriage rate of 5.9 per 1,000 people, combined with some of the oldest median marriage ages in the country (32.2 for men and 30.9 for women), suggests that relationships often unfold at a slower, more considered pace.
At the same time, interest in romance remains strong. Search behaviour around relationships and proposals shows that love is still very much part of the cultural conversation, even if milestones happen less frequently.
A divorce rate of 6.7 per 1,000 people sits below the national average, showing that commitment isn’t absent, but more selective. People in Rhode Island might take longer to reach key moments, but approach them with greater intention when they do.
With a marriage rate of 5.2 per 1,000 people and median marriage ages of 32.2 for men and 29.6 for women, it seems like relationships here often take time to evolve before becoming formal.
At the same time, there are clear signs that commitment is still actively considered. Maryland ranks relatively high for romance and engagement-related search interest, suggesting that the intent and desire for commitment remain strong.
However, a divorce rate of 8.4 per 1,000 people, above the national average, points to less consistent outcomes. Here, commitment isn’t disappearing; it’s still valued, but the path toward long-term stability can be less predictable.
In Massachusetts, commitment tends to come later, and often more deliberately. With a relatively low marriage rate of 5.2 per 1,000 people, and among the highest marriage ages in the country (32.4 for men and 30.9 for women), key milestones are typically reached further down the line.
At the same time, there are clear signs that commitment is still being actively considered. Massachusetts ranks among the top states for diamond-related searches, suggesting that while timelines may be extended, the desire to mark commitment in meaningful ways remains strong.
A divorce rate of 5.9 per 1,000 people, below the national average, adds to this picture, where fewer people are marrying, and doing so later, but those commitments are more likely to last.
In some states, romance isn’t left to chance; it’s planned, searched for and thoughtfully brought to life.
From finding the perfect way to propose to choosing the right ring or venue, this section explores where love is most actively expressed in the details. Using real search behaviour, it reveals where Americans are not just thinking about commitment, but imagining it, shaping it and finding ways to make it truly memorable.
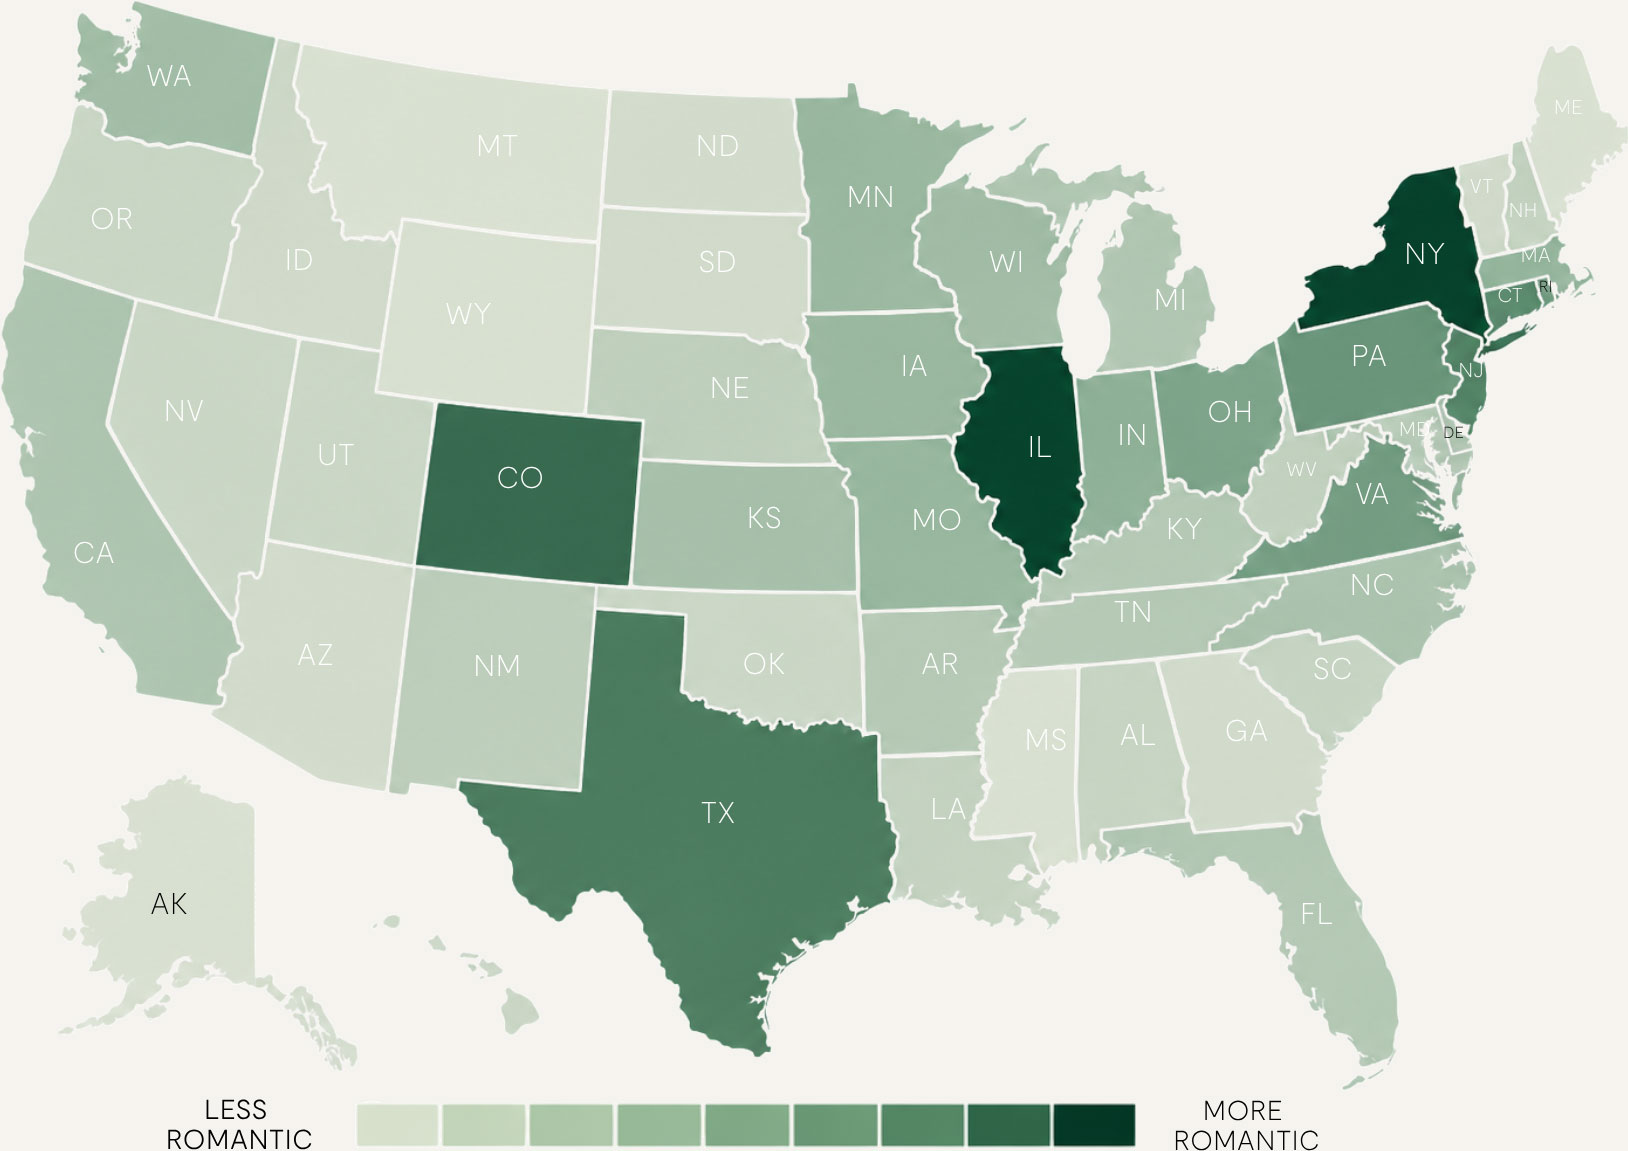
Source: Google Keyword Planner
| Rank | State | SV* |
|---|---|---|
| 1 | New York | 709 |
| 2 | Illinois | 643 |
| 3 | Colorado | 577 |
| 4 | Texas | 577 |
| 5 | New Jersey | 559 |
| 6 | Pennsylvania | 558 |
| 7 | Virginia | 553 |
| 8 | Ohio | 548 |
| 9 | Connecticut | 544 |
| 10 | Missouri | 543 |
* Search Volume per 100,000 people: Based on search behaviour from March 2025 to March 2026, analysing interest in proposals, engagement rings and wedding planning to reveal where romance is most actively expressed.
Ranking as the most romantic state in the U.S., New York records the highest number of searches across proposal ideas, engagement rings and wedding planning. From “how to propose” to “wedding venues,” the volume of searches points to a culture where love is carefully considered and the details matter.
That focus on planning suggests that commitment is something people spend time shaping before acting on. While New York ranks highly for romantic intent, it places lower on the overall Commitment Score, with a marriage rate of 6.5 per 1,000 people, indicating that while the idea of commitment is actively explored, the timeline to formalise it can be more extended.
Ranking second, Illinois sees around 82,000 searches across proposal ideas, engagement rings and wedding planning. From browsing ring styles to researching venues, there’s a steady, ongoing focus on how relationships move forward.
That consistency reflects a more practical approach to romance, less about grand gestures and more about getting the details right. While interest in love on screen remains strong, in Illinois, that attention carries into real life, where commitment is something actively planned and worked towards, rather than just imagined.
Ranking third, Colorado records around 35,000 searches, with particularly strong interest in engagement rings and wedding planning. Compared to other states, searches lean more towards the practical side of commitment rather than just proposal ideas alone.
Colorado has a more action-focused approach to romance. Instead of just thinking about the moment itself, people in Colorado are planning what comes next: getting things in place and building towards something long-term.
Ranking fourth, Texas records around 183,000 searches each month, with consistent interest across proposals, engagement rings and wedding planning. Rather than focusing on one moment, search behaviour shows that people are engaging with the full process of commitment, from deciding how to propose to planning what comes next.
As one of the few states to rank highly for both commitment and love on screen, Texas stands out for turning intent into action. Rather than stopping at inspiration, people appear to follow through, making it a place where romance is not just imagined, but fully lived out.
Rounding out the top five, New Jersey sees around 53,000 searches each month across proposals, engagement rings and wedding planning, but what stands out is how consistently romance shows up across everyday life.
It’s not just about big moments. From early ideas to final decisions, people here stay closely connected to the process, engaging with every stage rather than dropping in at one key point. Romance feels less like a single event and more like something that’s part of the day-to-day.
Not all commitment comes down to timing or intent; in many cases, it comes down to circumstance. This section looks beyond relationship behaviour to explore the conditions that shape when people feel ready to take the next step.
From income levels and student debt to the cost of living, housing, and weddings; these factors play a key role in how accessible commitment really is. In some states, lower everyday costs and more manageable expenses make it easier to move forward sooner. In others, higher financial pressures can shift timelines, even when the intent is there.
This section offers a different perspective on commitment, not just how it shows up, but where people are most set up to make it happen.
| Median household income ($) | Average student loan debt per borrower ($) | Cost of living index (U.S. Average = 100) | Rent index (U.S. Average = 100) | Average wedding cost ($) | Average engagement ring cost ($) | Financial readiness score (/100) | |
|---|---|---|---|---|---|---|---|
| South Dakota | 71,810 | 31,171 | 88.6 | 67.6 | 31,961 | 3,005 | 79.3 |
| Iowa | 71,433 | 30,698 | 87.8 | 65.3 | 32,237 | 4,939 | 76.0 |
| Oklahoma | 62,138 | 32,245 | 87.8 | 62.8 | 26,280 | 5,294 | 73.7 |
| West Virginia | 55,948 | 32,343 | 89.5 | 54.2 | 24,707 | 4,968 | 73.2 |
| Arkansas | 58,700 | 34,024 | 86.9 | 58.2 | 24,155 | 5,422 | 72.7 |
| North Dakota | 76,525 | 29,115 | 89.0 | 71.4 | 36,080 | 6,631 | 71.7 |
| Mississippi | 54,203 | 37,552 | 87.0 | 56.5 | 23,432 | 4,106 | 70.8 |
| Indiana | 69,477 | 33,234 | 93.3 | 73.9 | 30,180 | 4,181 | 70.0 |
| Nebraska | 74,590 | 32,206 | 90.1 | 75.2 | 33,755 | 5,873 | 69.1 |
| Alabama | 62,212 | 37,819 | 88.8 | 61.8 | 25,958 | 5,255 | 67.1 |
In South Dakota, the path to commitment tends to feel more straightforward. With a median household income of $71,810 (around $5,000 lower than the U.S. average), the difference is offset by a lower cost of living, which sits at 88.6 versus the national average of 100. Housing is also significantly more affordable, at around 67.6 compared to the national benchmark, making it easier to build financial stability early on.
That carries through to major milestones. The average wedding cost is $31,961, below the U.S. average of $35,487, while engagement rings average around $3,005, among the lowest in the country. Together, these factors make commitment feel more accessible, where moving from planning to actually taking the step is often less financially daunting.
In Iowa, there are fewer financial barriers when it comes to moving forward with commitment. While the median household income sits at $71,433 (below the U.S. average of $77,588), lower everyday costs make a noticeable difference. The cost of living is 87.8 compared to the national average of 100, and housing remains more affordable at 65.3, helping free up income for longer-term plans.
That ease carries into key milestones. Weddings cost an average of $32,237, below the national benchmark of $35,487, while engagement rings average around $4,939. With relatively lower student loan debt as well, young people feel more able and empowered to take the leap. Plus, the financial step between planning and committing is smaller, making it easier to act on intention without needing to delay.
In Oklahoma, big life moments don’t have to come with a big financial trade-off. Even with a household income of $62,138 (below the U.S. average of $77,588), lower everyday costs help create more room to plan ahead. The cost of living sits at 87.8 compared to the national average of 100, and housing is notably more affordable at 62.8, easing the pressure that can often delay long-term decisions.
That difference is especially visible when it comes to milestones. The average wedding cost is $26,280, nearly $10,000 less than the national average, while engagement rings come in at around $5,294. With fewer financial hurdles to navigate, moving from considering marriage to actually taking the next step can feel far more achievable.
In West Virginia, the cost of commitment is notably lower, and that changes the pace of decision-making. It’s one of the few places where everyday affordability genuinely shifts what feels possible.
Housing costs are the lowest in the country, sitting at just 54.2 compared to the national average, which creates more breathing room in monthly budgets. That has a knock-on effect: weddings average $24,707, over $10,000 less than the U.S. average, and engagement rings come in at around $4,968.
Rather than needing to plan around financial constraints, people here are often working with fewer trade-offs. When the baseline cost of living is lower, major milestones don’t feel like such a financial leap, making it easier to move forward.
Ranking sixth among the most committed states, Arkansas is a place where commitment often happens sooner, in part because it’s easier to make the numbers work. Lower living costs create a different starting point, where planning doesn’t feel as financially stretched as it can elsewhere.
Weddings average $24,155, one of the lowest in the country and well below the national average of $35,487, while engagement rings sit at around $5,422. Combined with a cost of living of 86.9 (compared to 100 nationally) and more affordable housing at 58.2, there’s less of a financial gap between intention and action.
Not all commitment plays out in real life. Some of the greatest romances live on screen.
This section looks at where Americans are most tuned into romance through TV and film, from Love Island and Married at First Sight to classic love stories like The Notebook. Using search behaviour as a proxy, it reveals where love isn’t just lived, but actively followed, rewatched and talked about.
| Rank | State | SV* |
|---|---|---|
| 1 | California | 810 |
| 2 | Texas | 788 |
| 3 | Massachusetts | 781 |
| 4 | Illinois | 781 |
| 5 | New York | 758 |
| 6 | New Jersey | 757 |
| 7 | Colorado | 723 |
| 8 | Arizona | 714 |
| 9 | Rhode Island | 705 |
| 10 | Nevada | 704 |
* Search Volume per 100,000 people

Henry B Platt and Audrey Hepburn on the set of Breakfast At Tiffany’s, 1961. (Getty Images)
Ranking highest for romance-led entertainment, California records over 318,000 monthly searches across shows and films like Love Island, Love is Blind,and The Notebook, making it the most engaged state when it comes to love on screen.
Yet this doesn’t directly translate into real-world commitment. California ranks significantly lower on the overall Commitment Score, suggesting that while people are deeply engaged with the idea of love, timelines and decisions around commitment may be more fluid. In this sense, romance in California often starts on screen, influencing how it’s imagined, even if it plays out differently in real life.
Ranking second for romance-led entertainment, Texas records around 250,000 average monthly searches, with particularly strong interest in shows like Love Island and The Bachelor.
Unlike California, this cultural interest aligns more closely with real-world behaviour. Texas also ranks within the top 10 most committed states, suggesting that for many, watching romance goes hand in hand with acting on it. Rather than just shaping perception, love on screen appears to reinforce real-life milestones, where inspiration and action move more closely together.
Ranking among the top states for romance-led entertainment, Massachusetts records around 56,000 average monthly searches, with strong interest across both reality dating shows like Love is Blind and Love Island.
However, this interest sits in contrast to real-world behaviour. Massachusetts ranks lower on the overall Commitment Score, indicating that while romance is highly visible in culture, commitment may be approached more cautiously. Here, love is closely followed and explored, but often on its own timeline.
In Illinois, romance feels like something to dip in and out of. With around 100,000 average monthly searches across romance TV, there’s strong interest in Love Island in particular, a show built on fast-moving connections, twists, and second chances.
While love is clearly part of the cultural backdrop, Illinois ranks lower on the overall Commitment Score, suggesting that real-life decisions don’t always follow the same pace or intensity as what’s watched on screen.
In New York, romance is everywhere, and people are clearly paying attention. With around 152,000 average monthly searches, the state shows strong interest across titles like Love Island, Love is Blind, and The Notebook, reflecting a fast-moving mix of modern dating culture and classic love stories.
But when it comes to real-life commitment, the picture shifts. New York ranks much lower on the overall Commitment Score, suggesting that while love is highly visible and constantly part of the conversation, acting on it often happens later. In a state where pace, priorities and possibilities are constantly evolving, commitment tends to follow its own timeline.
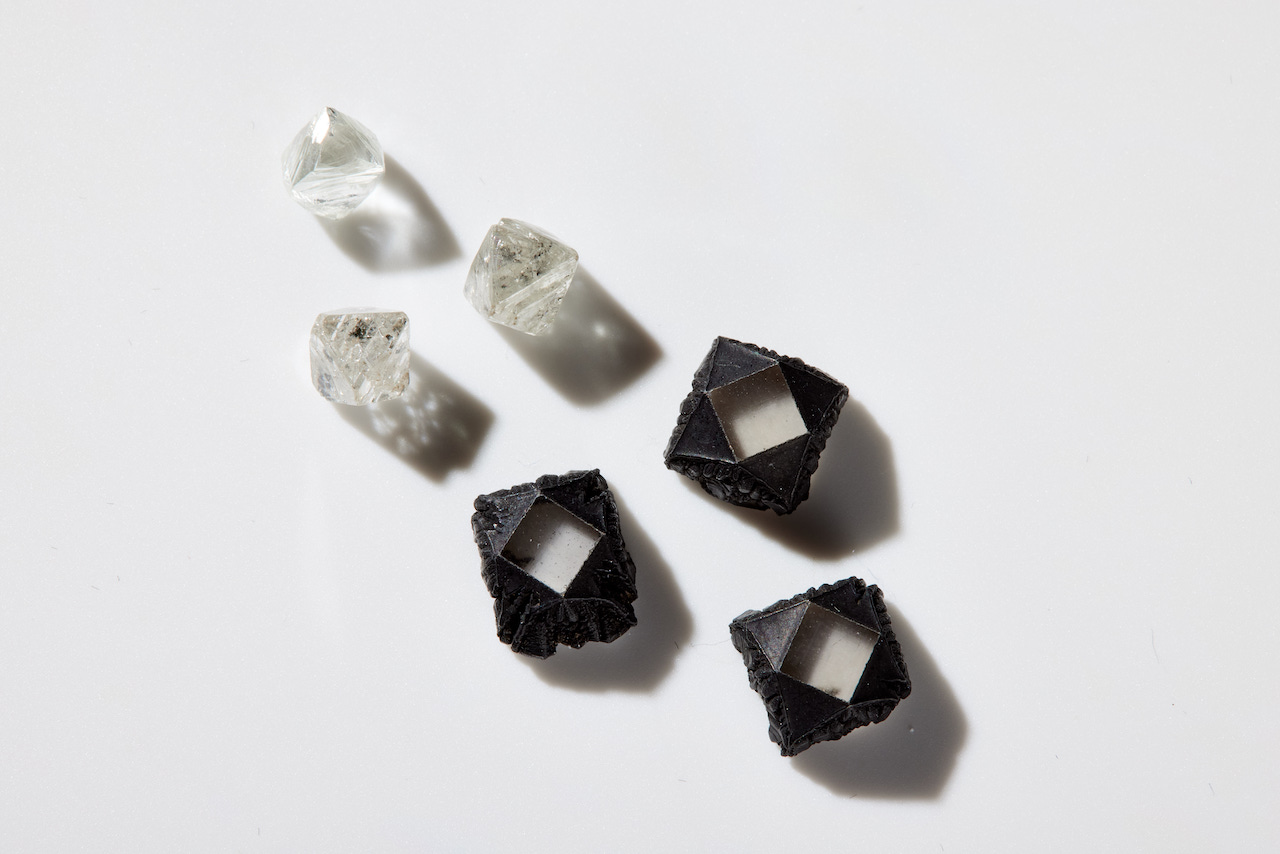
When it comes to choosing a diamond, the details matter.
Beyond size and sparkle, search behaviour reveals how people are thinking about one of the most symbolic purchases tied to commitment. This section explores what Americans are actively considering when selecting an engagement ring, highlighting the styles and specifications that stand out today.

Across the U.S., the sweet spot for engagement rings sits between 2 and 3 carats, with these sizes attracting nearly double the interest of smaller options like 1 and 1.5 carats.
This lines up closely with the 2025 Natural Diamond Council report, which highlights strong growth in the 2–2.24 carat category, up 30% over two years and now holding a 12% market share. Alongside this, 1.5-carat stones are also rising fast. Together, it signals a shift toward considered upgrades, where people are sizing up, but thoughtfully.
When it comes to diamond shape, search behaviour in Q1 2026 highlights what people are most actively exploring when researching engagement rings. Emerald cuts lead with over 60,000 searches nationwide, followed by oval (56,000 searches) and marquise shapes (27,000 searches).
At the same time, round cut diamonds continue to account for the majority of engagement ring sales in the U.S., reflecting their enduring appeal and timeless place in the market.
This suggests that alongside classic choices, people are also looking into alternative styles like emerald, oval and marquise, pointing to a more personal approach to ring selection, where choices reflect personal style and individuality.
Data from the 2025 Natural Diamond Trends report from Natural Diamond Council shows that natural diamond demand is still strongly anchored around key moments in the calendar. The end-of-year holiday season stands out as the most significant, with November and December accounting for 30% of diamond sales in 2025. Late December is particularly active, with several of the highest sales days falling just before Christmas.
This period also aligns with engagement behaviour. December is the most popular month to get engaged, with Christmas Day itself being the single most common date.
Beyond the holidays, Valentine’s Day and Mother’s Day continue to play a meaningful role, contributing 7% and 9% of annual demand, respectively. These moments highlight how natural diamonds are often tied to occasions that celebrate love, connection and milestones, whether romantic, personal or familial, and can become heirloom pieces passed down through generations.
NDC’s 2026 Relationship Commitment Report ranks all 50 U.S. states using a Commitment Score out of 100, designed to reflect how commitment is expressed today. The approach combines behavioural data, cultural signals and relationship outcomes to provide a balanced view of modern commitment.
The overall score is built from three core pillars:
Where relevant, search data is adjusted for population size to ensure fair comparison across states.
Commitment Readiness is analysed separately and not included in the final score. This includes factors such as median household income, student loan debt, cost of living, housing costs, and wedding and engagement ring costs, providing context on how prepared people are to take the next step.
Data is sourced from official government sources, including the CDC, U.S. Census Bureau (American Community Survey), Federal Student Aid, Bureau of Economic Analysis (BEA), and leading industry reports.
| Marriage Rate (per 1,000 people) | Marriage Age (Male) | Marriage Age (Female) | Male never married (%) | Female never married (%) | Married, Spouse Absent, Separated (Male) | Married, Spouse Absent, Separated (Female) | Divorced (Male) | Divorced (Female) | Divorce rate (per 1,000 people) | Median household income ($) | Average student loan debt per borrower ($) | Cost of living index (U.S. Average = 100) | Rent index (U.S. Average = 100) | Average wedding cost ($) | Average engagement ring cost ($) | |
|---|---|---|---|---|---|---|---|---|---|---|---|---|---|---|---|---|
| Alabama | 6.9 | 29.6 | 27 | 13.44 | 12.61 | 31874 | 41070 | 207424 | 282693 | 9.1 | 62,212 | 37,819 | 88.8 | 61.8 | 25,958 | 5,255 |
| Alaska | 6.4 | 28.3 | 25.5 | 16.98 | 11.36 | 3716 | 3315 | 27769 | 34740 | 5.5 | 86,631 | 35,874 | 102.4 | 93.8 | 45,604 | 6,143 |
| Arizona | 5.6 | 30.9 | 28.4 | 15.56 | 13.02 | 34599 | 43074 | 299624 | 401398 | 7.3 | 77,315 | 35,792 | 100.7 | 106.8 | 33,177 | 6,684 |
| Arkansas | 7.8 | 27.2 | 25.8 | 12.98 | 10.97 | 17144 | 24441 | 137178 | 173572 | 11.9 | 58,700 | 34,024 | 86.9 | 58.2 | 24,155 | 5,422 |
| California | 5.5 | 32.1 | 30.4 | 17.12 | 14.89 | 248329 | 336812 | 1152120 | 1666061 | 5.9 | 95,521 | 38,300 | 110.7 | 154.3 | 46,300 | 9,482 |
| Colorado | 7.8 | 30.8 | 28.6 | 15.25 | 12.20 | 26240 | 34394 | 220152 | 299379 | 8.5 | 92,911 | 37,393 | 103.1 | 127.4 | 39,808 | 5,858 |
| Connecticut | 6.2 | 32.4 | 30.3 | 16.10 | 14.76 | 10816 | 20870 | 128558 | 185154 | 6.4 | 91,665 | 36,837 | 103.6 | 117.0 | 44,696 | 4,261 |
| Delaware | 4.7 | 31.1 | 29.7 | 14.31 | 13.48 | 5402 | 7458 | 37034 | 58381 | 9.1 | 81,361 | 38,856 | 99.8 | 102.0 | 38,018 | 4,106 |
| Florida | 7 | 31.2 | 29.3 | 14.36 | 12.50 | 140467 | 198095 | 982702 | 1401052 | 7.3 | 73,311 | 39,574 | 103.4 | 122.1 | 30,951 | 8,809 |
| Georgia | 5.9 | 30.8 | 28.8 | 14.64 | 13.94 | 70574 | 93783 | 392945 | 588751 | 8.7 | 74,632 | 42,226 | 96.3 | 88.7 | 32,545 | 6,868 |
| Hawaii | 12.5 | 30.9 | 29.7 | 15.92 | 13.39 | 7177 | 10115 | 54730 | 63541 | 7.1 | 95,322 | 38,929 | 110.0 | 125.3 | 53,369 | 5,733 |
| Idaho | 7 | 28.2 | 25.4 | 12.86 | 10.35 | 7976 | 7603 | 83281 | 105313 | 9.2 | 74,942 | 33,621 | 95.5 | 90.0 | 30,807 | 5,197 |
| Illinois | 5.1 | 31.3 | 29.9 | 16.03 | 14.57 | 69017 | 86959 | 422276 | 576378 | 5.7 | 80,306 | 39,042 | 100.0 | 93.9 | 35,914 | 9,197 |
| Indiana | 5.9 | 29.5 | 27.5 | 14.08 | 12.12 | 28784 | 42208 | 294303 | 370375 | 9 | 69,477 | 33,234 | 93.3 | 73.9 | 30,180 | 4,181 |
| Iowa | 5.2 | 29.4 | 26.9 | 14.47 | 11.71 | 14519 | 18097 | 122460 | 151842 | 6.9 | 71,433 | 30,698 | 87.8 | 65.3 | 32,237 | 4,939 |
| Kansas | 5.3 | 28.8 | 26.2 | 14.02 | 11.37 | 11050 | 14095 | 114981 | 140590 | 8.3 | 70,333 | 33,013 | 90.1 | 71.2 | 30,775 | 8,947 |
| Kentucky | 6.1 | 27.8 | 26.5 | 13.50 | 11.41 | 29404 | 34262 | 208273 | 260405 | 9.9 | 61,118 | 33,691 | 90.2 | 64.3 | 25,899 | 7,918 |
| Louisiana | 3.7 | 30.2 | 27.3 | 15.19 | 14.19 | 33430 | 39797 | 181109 | 244417 | 8.5 | 58,229 | 34,821 | 88.2 | 63.1 | 26,457 | 7,959 |
| Maine | 7 | 30.5 | 28 | 13.51 | 11.51 | 6014 | 4893 | 69066 | 86768 | 6.4 | 73,733 | 34,355 | 97.1 | 78.9 | 37,727 | 3,184 |
| Maryland | 5.2 | 32.2 | 29.6 | 15.35 | 14.92 | 34787 | 43067 | 196477 | 305071 | 8.4 | 98,678 | 43,781 | 105.0 | 121.1 | 45,693 | 7,553 |
| Massachusetts | 5.2 | 32.4 | 30.9 | 16.51 | 15.77 | 40330 | 50773 | 224056 | 334213 | 5.9 | 99,858 | 35,400 | 105.8 | 128.1 | 49,281 | 8,193 |
| Michigan | 5 | 31 | 28.7 | 15.38 | 13.50 | 36729 | 48148 | 399492 | 512890 | 6.2 | 69,183 | 36,973 | 96.2 | 82.3 | 30,734 | 8,535 |
| Minnesota | 4.8 | 30.6 | 28.6 | 14.94 | 12.73 | 19932 | 25499 | 204384 | 266498 | 5.7 | 85,086 | 34,163 | 98.6 | 91.3 | 37,808 | 7,050 |
| Mississippi | 5.5 | 27.5 | 26.5 | 14.00 | 13.58 | 23819 | 31059 | 117649 | 157256 | 8.3 | 54,203 | 37,552 | 87.0 | 56.5 | 23,432 | 4,106 |
| Missouri | 5.7 | 29.2 | 26.8 | 13.97 | 12.20 | 29874 | 42446 | 252480 | 340279 | 7.5 | 68,545 | 35,650 | 90.8 | 69.9 | 31,178 | 7,071 |
| Montana | 9.2 | 30.5 | 28 | 14.70 | 11.13 | 3920 | 4196 | 49907 | 55670 | 6.7 | 70,804 | 34,215 | 94.6 | 84.6 | 32,217 | 6,353 |
| Nebraska | 5.3 | 29.2 | 26.8 | 13.99 | 11.34 | 6267 | 7734 | 70326 | 88925 | 7.1 | 74,590 | 32,206 | 90.1 | 75.2 | 33,755 | 5,873 |
| Nevada | 24.6 | 31.7 | 30 | 16.21 | 13.19 | 21737 | 24142 | 153321 | 192390 | 7.8 | 76,364 | 34,756 | 100.0 | 114.1 | 32,116 | 6,560 |
| New Hampshire | 6.6 | 32.4 | 30 | 14.55 | 11.75 | 4408 | 6894 | 60902 | 83021 | 6.3 | 96,838 | 34,860 | 104.2 | 114.9 | 45,729 | 6,832 |
| New Jersey | 5.4 | 31.6 | 29.8 | 15.19 | 13.95 | 56601 | 70901 | 254457 | 387324 | 5.2 | 99,781 | 37,287 | 108.8 | 134.3 | 46,794 | 8,842 |
| New Mexico | 4.7 | 32 | 29.4 | 16.90 | 14.11 | 11549 | 15682 | 96214 | 131920 | 9.1 | 62,268 | 34,256 | 92.2 | 73.6 | 23,776 | 5,996 |
| New York | 6.5 | 31.9 | 30.4 | 16.69 | 16.01 | 140614 | 195380 | 585421 | 873135 | 5.7 | 82,095 | 38,751 | 107.9 | 122.2 | 42,026 | 8,785 |
| North Carolina | 6 | 29.9 | 27.5 | 14.10 | 13.05 | 71452 | 102008 | 372747 | 545215 | 8.2 | 70,804 | 38,929 | 94.3 | 81.4 | 30,761 | 7,133 |
| North Dakota | 5.1 | 28.3 | 26 | 15.74 | 10.91 | 2556 | 2959 | 30831 | 34870 | 8.2 | 76,525 | 29,115 | 89.0 | 71.4 | 36,080 | 6,631 |
| Ohio | 5.9 | 30.1 | 27.5 | 14.76 | 13.05 | 61840 | 75043 | 480498 | 631178 | 6.7 | 67,769 | 35,072 | 92.8 | 73.0 | 31,779 | 7,796 |
| Oklahoma | 5.8 | 28.1 | 26.4 | 13.70 | 11.15 | 25846 | 30563 | 188004 | 220459 | 9.3 | 62,138 | 32,245 | 87.8 | 62.8 | 26,280 | 5,294 |
| Oregon | 5.8 | 30.3 | 29.2 | 15.36 | 12.73 | 19038 | 23915 | 185268 | 248110 | 7.3 | 80,160 | 38,036 | 103.4 | 108.6 | 38,514 | 5,126 |
| Pennsylvania | 5.3 | 30.9 | 29.3 | 15.35 | 13.83 | 74721 | 102080 | 447697 | 595515 | 5.9 | 73,824 | 36,120 | 97.6 | 85.1 | 36,985 | 7,552 |
| Rhode Island | 5.9 | 32.2 | 30.9 | 17.16 | 15.62 | 6926 | 7889 | 40738 | 57470 | 6.7 | 84,972 | 33,400 | 102.3 | 105.6 | 39,406 | 5,185 |
| South Carolina | 6.2 | 29.5 | 28 | 13.54 | 12.58 | 37804 | 52109 | 183827 | 277691 | 7.5 | 67,804 | 38,715 | 93.7 | 80.5 | 28,932 | 7,874 |
| South Dakota | 5.9 | 27.5 | 26.2 | 14.02 | 11.21 | 2805 | 2982 | 34817 | 39682 | 8 | 71,810 | 31,171 | 88.6 | 67.6 | 31,961 | 3,005 |
| Tennessee | 7.3 | 28.7 | 27.1 | 13.41 | 12.08 | 47224 | 57624 | 294308 | 390613 | 9.1 | 67,631 | 37,054 | 91.9 | 79.1 | 29,504 | 7,368 |
| Texas | 5.8 | 30.4 | 27.9 | 14.75 | 12.70 | 199531 | 280773 | 996176 | 1420578 | 7.4 | 75,780 | 33,770 | 97.1 | 96.5 | 31,577 | 8,063 |
| Utah | 11.2 | 27.2 | 25.2 | 14.31 | 11.49 | 12005 | 15009 | 102017 | 132566 | 8.1 | 93,421 | 33,872 | 98.9 | 107.8 | 38,382 | 3,184 |
| Vermont | 7.2 | 30.8 | 29.8 | 14.99 | 13.81 | 2258 | 2882 | 31504 | 36665 | 4.6 | 81,211 | 37,760 | 98.0 | 86.5 | 39,616 | 4,911 |
| Virginia | 5.8 | 30.8 | 28.7 | 14.47 | 12.89 | 57128 | 76828 | 297113 | 434688 | 7.9 | 89,931 | 40,287 | 101.1 | 106.8 | 40,073 | 7,934 |
| Washington | 5.6 | 31 | 28.8 | 15.27 | 12.25 | 36711 | 51664 | 296337 | 414223 | 7 | 94,605 | 36,709 | 107.0 | 126.0 | 46,348 | 10,109 |
| West Virginia | 5.8 | 27.7 | 26.8 | 13.57 | 10.85 | 7555 | 12433 | 90022 | 98909 | 9.7 | 55,948 | 32,343 | 89.5 | 54.2 | 24,707 | 4,968 |
| Wisconsin | 5 | 30.5 | 28.3 | 15.14 | 12.84 | 19897 | 21918 | 237651 | 291600 | 5.9 | 74,631 | 32,619 | 94.1 | 79.3 | 34,289 | 5,661 |
| Wyoming | 7 | 28.7 | 25.9 | 13.47 | 9.72 | 3288 | 3285 | 23855 | 28529 | 11 | 72,415 | 30,631 | 92.7 | 71.1 | 35,757 | 6,670 |