Diamond Facts and Statistics That Matter
See the most up-to-date natural diamond industry production data and learn more facts about the diamond industry and its various commitments.
Click here to access more education and marketing materials.
Understanding Diamond Production Data
Diamond production data by country is collected by the Kimberley Process Certification Scheme (KPCS) in volume (carats) and US dollar value. The data, published annually approximately six months after the year-end, covers an estimated 99.8% of global production.
World Diamond Production in Carats and Value 2023
| Carats | Value | |||
|---|---|---|---|---|
| ‘000 | % share | $m | % share | |
| Russia | 37,317 | 33% | 3,606 | 28% |
| Botswana | 25,095 | 23% | 3,283 | 26% |
| Canada | 15,981 | 14% | 1,550 | 12% |
| Angola | 9,754 | 9% | 1,532 | 12% |
| Namibia | 2,385 | 2% | 1,234 | 10% |
| South Africa | 5,892 | 5% | 794 | 6% |
| Zimbabwe | 4,914 | 4% | 303 | 2% |
| Lesotho | 472 | 0% | 139 | 1% |
| Sierra Leone | 525 | 0% | 102 | 1% |
| DRC | 8,347 | 7% | 65 | 1% |
| Tanzania | 191 | 0% | 31 | 0% |
| Others | 650 | 1% | 85 | 1% |
| Totals | 111,523 | 100% | 12,725 | 100% |
Source: Kimberley Process Certification Scheme
Source: Kimberley Process Certification Scheme
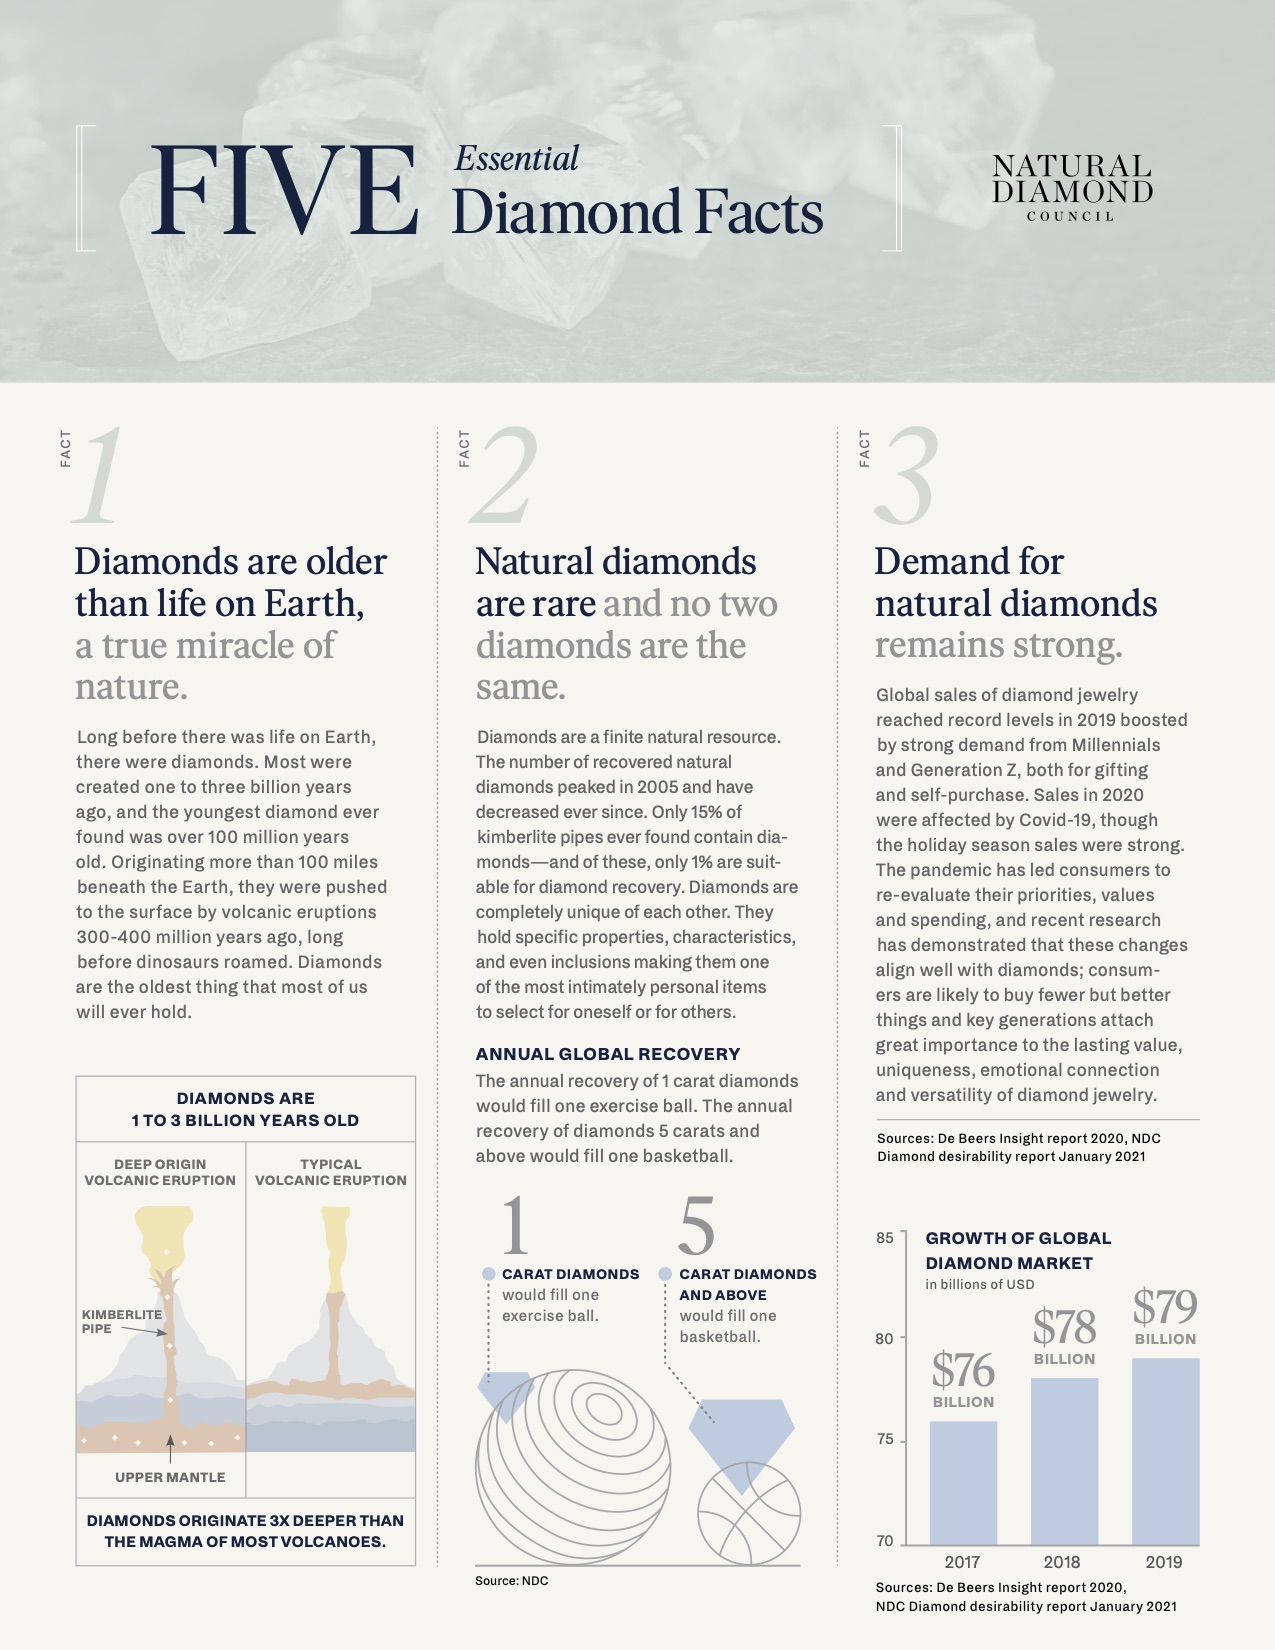
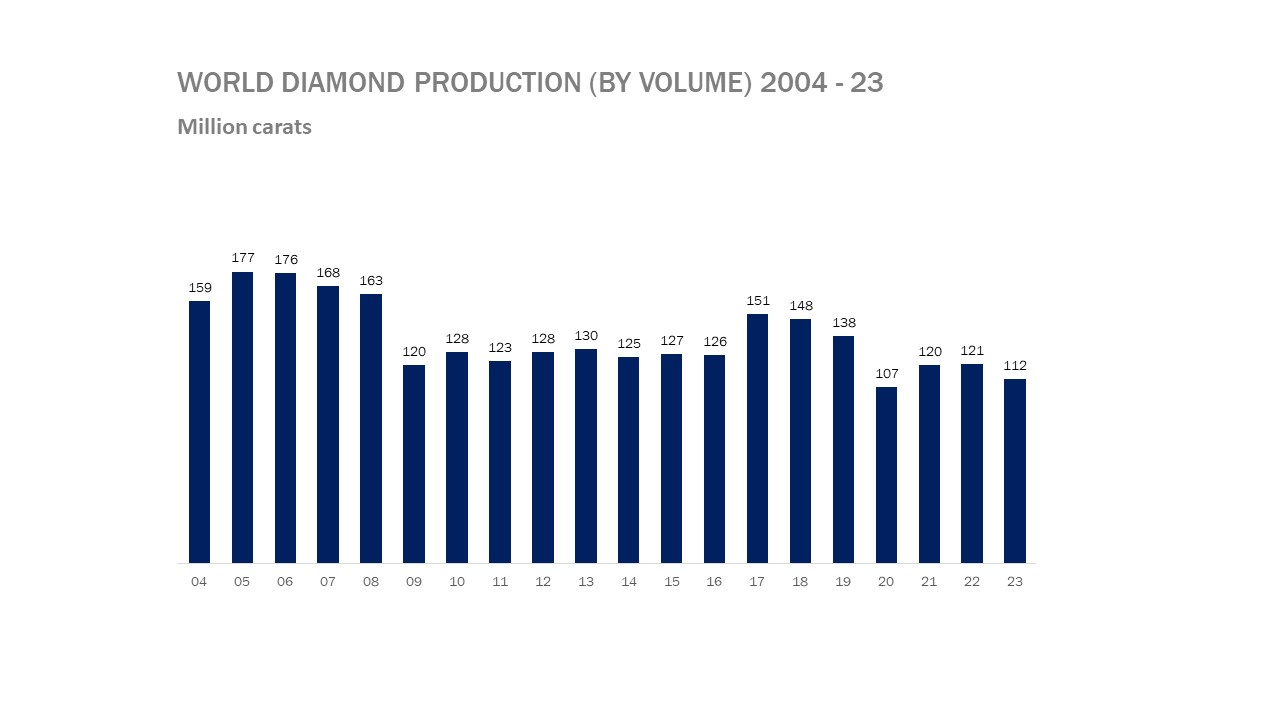
World Diamond Production by Volume 2019 – 23 Million carats
| 2019 | 2020 | 2021 | 2022 | 2023 | |
|---|---|---|---|---|---|
| Russian Federation | 45.3 | 31.2 | 39.1 | 41.9 | 37.3 |
| Botswana | 23.7 | 16.9 | 22.9 | 24.5 | 25.1 |
| Canada | 18.6 | 13.1 | 17.6 | 16.2 | 16.0 |
| Angola | 9.1 | 7.7 | 8.7 | 8.8 | 9.8 |
| Congo, Dem. Rep. | 14.2 | 12.7 | 14.1 | 10.8 | 8.3 |
| South Africa | 7.2 | 8.5 | 9.7 | 9.7 | 5.9 |
| Zimbabwe | 2.1 | 2.7 | 4.2 | 4.5 | 4.9 |
| Namibia | 2.0 | 1.5 | 1.8 | 2.1 | 2.4 |
| Sierra Leone | 0.8 | 0.6 | 0.8 | 0.7 | 0.5 |
| Lesotho | 1.1 | 0.5 | 0.3 | 1.3 | 0.4 |
| Australia | 13.0 | 10.9 | 0 | 0 | 0 |
| Others | 1.1 | 0.6 | 0.7 | 1.1 | 0.7 |
| TOTAL | 138.2 | 107.1 | 120.0 | 121.5 | 111.5 |
Source: Kimberley Process Certification Scheme
Source: Kimberley Process Certification Scheme
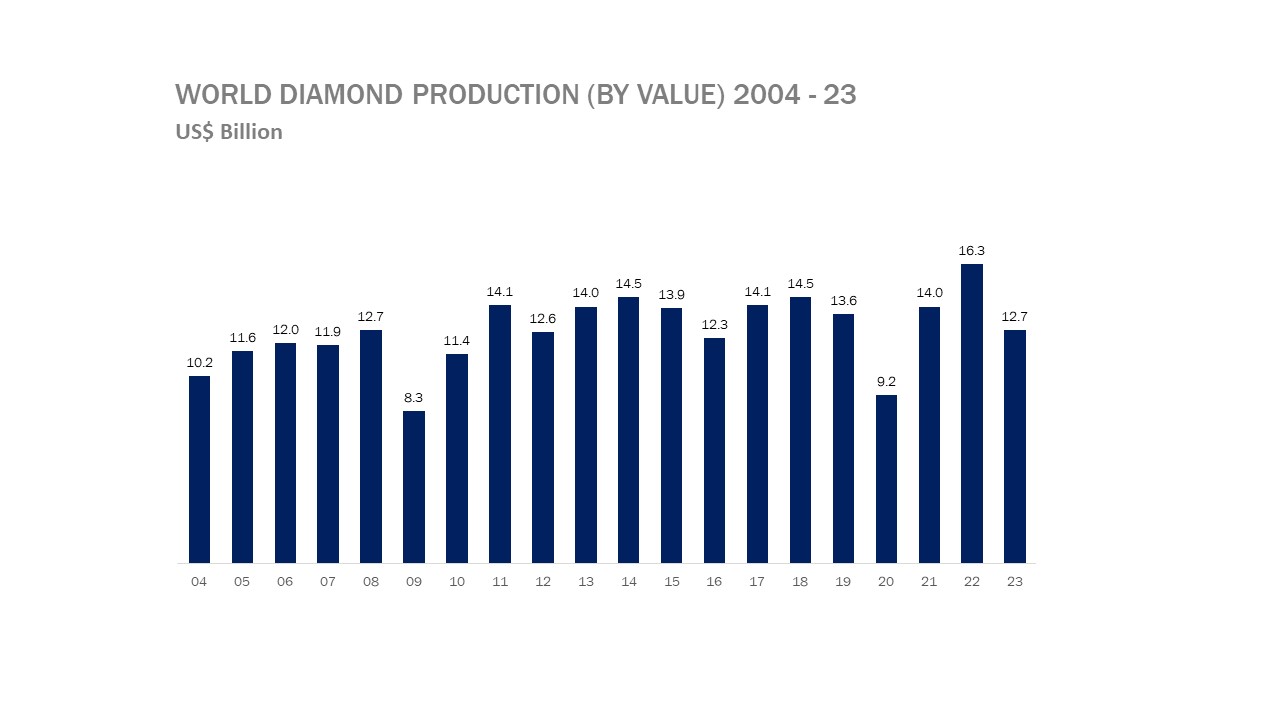
World Diamond Production by Value 2019 – 23 $M
| 2019 | 2020 | 2021 | 2022 | 2023 | |
|---|---|---|---|---|---|
| Russian Federation | 4,117 | 2,255 | 2,643 | 3,554 | 3,606 |
| Botswana | 3,435 | 2,521 | 4,657 | 4,700 | 3,283 |
| Canada | 1,697 | 929 | 1,512 | 1,878 | 1,550 |
| Angola | 1,266 | 1,017 | 1,626 | 1,965 | 1,532 |
| Namibia | 1,010 | 720 | 823 | 1,234 | 1,234 |
| South Africa | 873 | 958 | 1,360 | 1,539 | 794 |
| Zimbabwe | 141 | 153 | 670 | 424 | 303 |
| Lesotho | 290 | 261 | 257 | 558 | 139 |
| Sierra Leone | 168 | 119 | 164 | 143 | 102 |
| DRC | 226 | 89 | 168 | 77 | 65 |
| Tanzania | 89 | 24 | 24 | 111 | 31 |
| Australia | 159 | 118 | – | – | – |
| Others | 192 | 93 | 111 | 102 | 85 |
| TOTAL | 13,574 | 9,235 | 13,989 | 16,285 | 12,725 |
Source: Kimberley Process Certification Scheme
Downloads
Excel file for production data 2004-2023


Get the Newsletter
Sign up for the latest diamond news, delivered directly to your inbox.


